| Accession number: | 10010 | |
| VFB id: | FBbt_00100482   | |
| Neuron name: | LC10 |
| Synonyms: | AOT, S3, LCN, LCL8 |
| Position of cell bodies: | LCBR-LD |
| Number of cells: | 84-90? |
| Neuron class: | visual projection neuron, lobula columnar neuron |
| Innervating regions: | LO3, LO4, LO5, LO6, OTU |
| Presynaptic sites: | LO6, OTU |
| Postsynaptic sites: | |
| Direction of information: | centripetal |
| Laterality: | ipsilateral |
| Publications: | -
Otsuna and Ito (2006) J. Comp. Neurol. 497:928-958
-
Fischbach and Dittrich (1989) Cell Tissue Res. 258:441-475
-
Fischbach and Lyly-Hunerberg (1983) Cell Tissue Res. 231:551-563 |
| |
| Strains / Antibodies: | NP0681-Gal4, NP6250-Gal4, NP7067-Gal4 |
| |
| Morphological description: | Among the three LC types that comprise the AOT, LC10 is the only pathway that projects to the optic tubercle (optu). It has previously been identified as S3 (Fischbach and Lyly-Hünerberg, 1983; Fischbach and Dittrich, 1989) and LCN (Fischbach, 1983). In the lobula LC10 neurons arborize in LO3, 4, 5 and 6 layers. In most of the samples we examined, the distal (medial) end of the AOT thickens to form a cone like structure of the optu. Extensive terminal arborization is observed in this region.
The cell bodies of LC6, 9 and 10 form a single large cluster in the mid dorsal area of the lateral cell body region. Like all other LCs, the cell body fibers run towards the lobula neck and bifurcate there.
The optu can be divided into three regions according to the density of the arborizations (Figures 2-4). The medialmost (optu1) and lateralmost (optu3) regions are contributed with the dense arborizations of the LC10 neurons. The area in between (optu2) is essentially devoid of the LC terminals. High-magnification reconstruction of this area suggests that there are three different types of fibers.
It is likely that the LC10 neurons can be classified into three subtypes, which we named as LC10A, B and C. Though we could not isolate the GAL4 strains that label each subset of the LC10 neurons, in one of the three DsRed samples we found that GAL4 accidentally failed to drive the DsRed expression in LC10B and C neurons, visualizing clearly the trajectory of the LC10A neurons (Figure 4). The axons of the LC10A neurons run through the ventral area of the optu to circumvent the optu2. Upon they reach the optu1, they project dorsally and terminate in the anterior area of the optu1. LC10B axons run in the dorsal region of the optu, project straight through the optu2 and terminate in the posterior dorsal area of the optu1. LC10C axons are shorter and terminate in the optu3.
In the optic lobe, n-syb::GFP signal is observed in the LO6 layer (Figure 5). The varicosities in the LO3-5 layers are devoid of presynapses and are hence likely to be postsynaptic. In the optu, presynaptic sites are distributed throughout the optu1 and at the medial end of the optu3.It is therefore likely that LC10 neurons form a centripetal pathway that collects information from LO3-5 layers and transmit the signal first to LO6 and then to the optu1 and optu3.
Though none of the GAL4 strains labeled LC10 specifically when UAS-GFP was used as reporter, the combination of the NP0681 and NP7067 strains with the UAS-DsRed strain visualized LC10 neurons specifically. The cell number of the LC10 neurons visualized in this way was 84-90.
(Otsuna and Ito, 2007)
|
| |
| Functional description: | |
| |
| |
| Figure 1: | 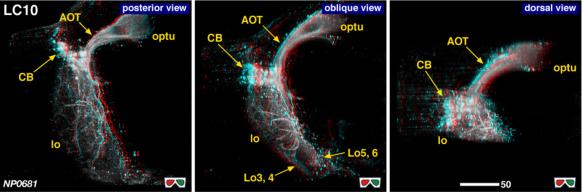 |
| 3D stereograms from three viewing angles. (Neurons other than LC10 are erased from the data. )
CB, position of the cell bodies; neck, medial edge of the lobula where all the lobula-specific VPNs converge; AOT, anterior optic tract; LO3, 4, 5, 6, arborized layers in the lobula. Modified from Otsuna and Ito (2006).
|
| |
Figure 2: | 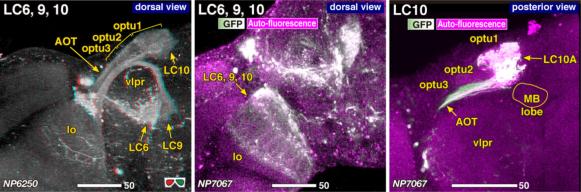 |
| Combined staining of LC6, 9 and 10, showing the spatial relationship of each pathway. optu1, 2, 3, three zones of the optic tubercle. Modified from Otsuna and Ito (2006).
|
| |
Figure 3: | 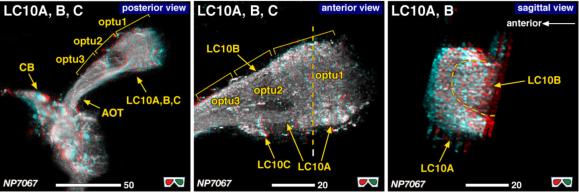 |
| Innervation of LC10 in the optu. Dashed line in the mid panel indicates the position of the cross section shown in the right panel. Dashed line in the right panel indicates the border between the arborizations of LC10A and LC10B. Modified from Otsuna and Ito (2006). |
| |
Figure 4: | 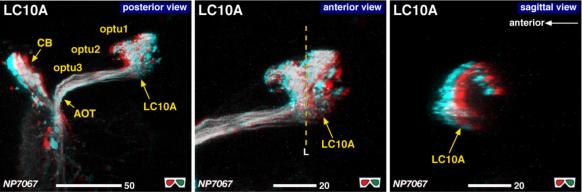 |
| Innervation of LC10 in the optu in a sample in which only LC10A neurons are labeled incidentally. Dashed line in the mid panel indicates the position of the cross section shown in the right panel. Modified from Otsuna and Ito (2006). |
| |
Figure 5: | 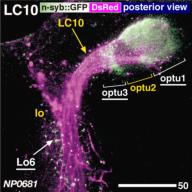 |
| Distribution of the presynaptic sites. Staining with the presynaptic site-targeted n-syb::GFP (green to white) and cytoplasmic DsRed (magenta). White characters with under bar indicate the areas of arborizations with presynaptic sites. Modified from Otsuna and Ito (2006). |
| |
File 1: | 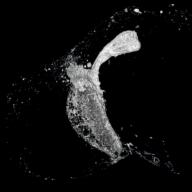 |
| QTVR movie of LC10. from Otsuna and Ito (2006). |